
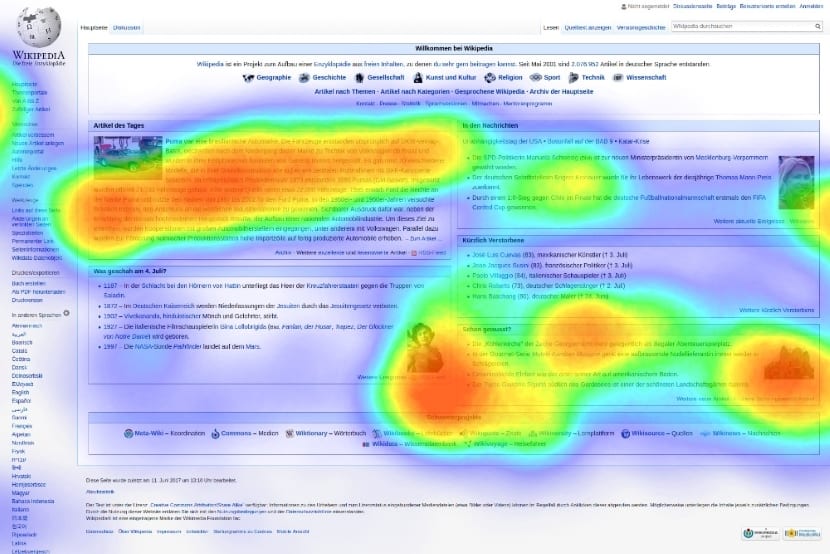
Heat maps, also called heatmaps, provide us with the data that They allow us to find out how, how and where users interact with our website. Although in reality, the most important thing is the interpretation that we make of these data. Depending on what our objective is, we can interpret, and consequently direct, that data in the direction and objectives that we want. In this case, to improve the web conversion of users.
In today's article, we are going to see 5 tools based on heat maps, to improve the conversion. With this, you will learn to identify the "hottest" areas, those in which users tend to pay more attention. Also to find out which elements arouse the most interest, and consequently, invest your efforts in making the action you expect from your website visitors visible and attractive.
Tips to improve conversion with heat maps

- Content. It is the most basic and also important aspect of a website, its content. There are no limits to its extension, as long as it contributes what users are looking for. That is, content that is extensive and lacking in consistency and / or arguments that add value will make a large part of your audience bounce. Therefore, it is important monitor the quality of what is contributed, and that is useful for users. In case something goes wrong, a heat map can warn us from when users lose interest, and of course which areas have attracted the most attention.
- Call and / or action buttons (CTA). Paying attention to what users click on will help us see how effective the CTAs we have incorporated are. In the end, they are the ones that will generate the conversion, and with a heat map we can see how well users serve them. Whether for an online store, to subscribe, etc.
- Perform A / B tests. By creating two versions (or more, depending on the program) of your same website, you will be able to see which version works better. It is ideal if you have high traffic, to be able to obtain more realistic and adjusted statistics. With this, once you have good content and multimedia, you can improve the conversion even more, by having your website well optimized and focused on your main objective. Improve conversion.
From here, there are different programs to make the heat maps. We are going to see 5 suitable tools for these purposes.
Sumo
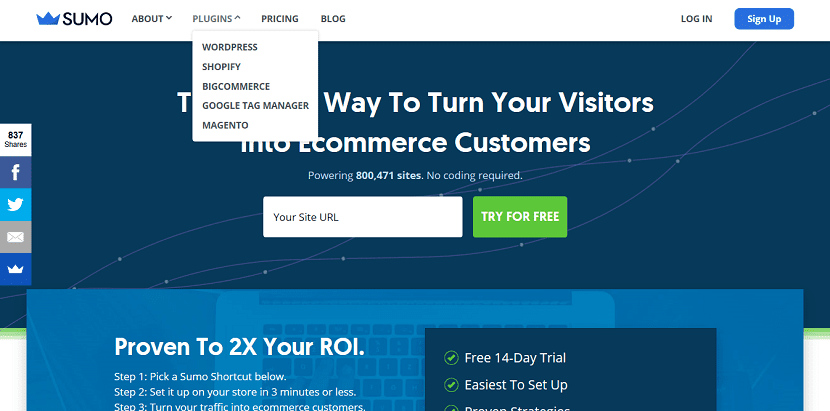
Sumo is a heatmap management and information tool for WordPress. Heat maps can be generated and managed from the WordPress dashboard. Once the plugin is installed, you have to configure it, which is very simple.
To generate the heat map With Sumo, the ideal is to go to our website, from our WordPress account. Once the web is open, on our right, we will have a side panel with an icon in the shape of a fire that says "Heat map", and by clicking on it a tab will be displayed. Where it says "RECORD" (record or record, in Spanish), we can click and start recording all the clicks that are going to be generated from this moment on.
To stop recording, we can enter our page directly from WordPress, as we did in the previous process to start the recording, or access the Sumo page.
To manage Sumo heat maps, we enter our WordPress panel, and in the Sumo Configuration panel, we go to the Analytics section and from there we click on Heat Maps. From there, we can see for example in Campaigns (campaigns), and you can see the heat map recordings that are being made at that time and since when they are activated.
Hotjar
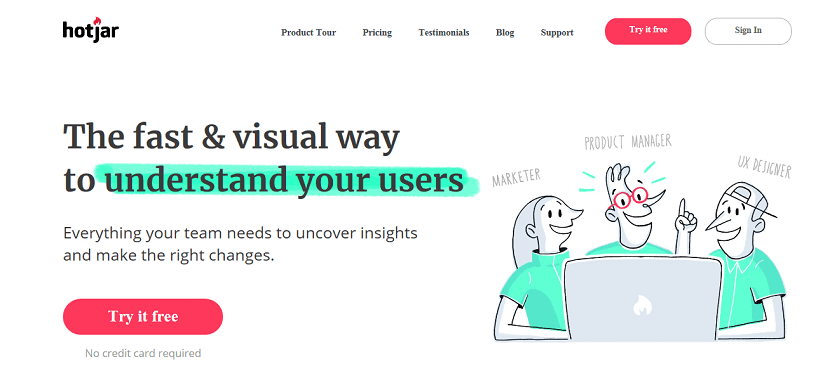
Hotjar is a tool to create responsive Heat Maps that allows you to create them indistinctly from the device that users are connecting. Either from a computer, tablet or mobile phone. It offers 3 different types of maps:
- Clicks. It registers the areas with the highest density of clicks with the shades of colors, from the coldest areas, in blue, or the hottest areas, in red. This mode is therefore only available for computers. It is due to the type of «Tap» of tablets and mobiles.
- Scroll. With this map we can see to what depth our landing page receives the scroll from users. If at some point they start to stop, we can appreciate what it is due to. Either from a bad content, to that by some image or paragraph, it is interpreted that the end had already been reached, etc.
- Mouse movement. Like click heat maps, this option is only available for computers.
Hotjar also allows recordings to know everything about the interaction of users with your website, from the movements of the mouse, how they scrolled, where they were clicking, etc. It even has a tool to measure conversion rates from the steps you indicate.
Crazy Egg
Another very popular tool for making heat maps. Crazy Egg has some advantages over its competitors like the "confetti maps." In this way, clicks are seen more precisely, leaving the colored areas of heat maps. It also has "Overlay" maps, where you can see up to the percentage of interactions.
Among other differences, it is that it saves a history of views, it is very intuitive, and it is not as expensive as other tools for the same use.
ClickTale
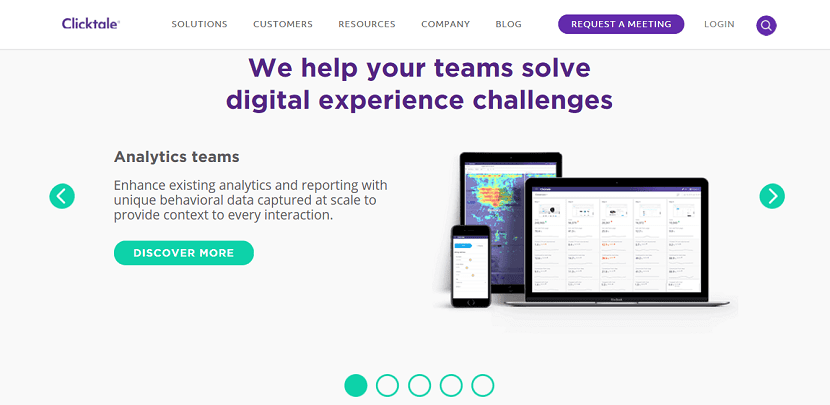
Along with Crazy Egg, they are the two main ones that dominate the market. ClickTale It is a very complete tool that allows us to extract a lot of analysis and data from the traffic of our website. It can be tried for free, and you can see the movements of the users even in real time. Of course, it is a fairly complex tool, with a fairly steep learning curve. It is recommended especially for large companies or places with a considerable volume of traffic.
Yandex Metrica
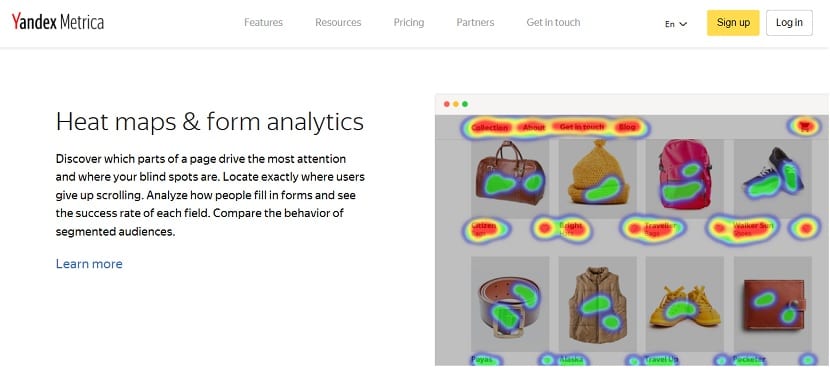
I already mentioned this in another article, but I put it back because it is ideal for tighter pockets. Yandex Metrica is a free tool, with which to obtain scroll maps, session recording, click maps (similar to those of Google Analytics).
In addition, we find other uses such as deep analysis of the web, such as segmentation, conversion flows, traffic in general, and everything in an intuitive and very simple way. A great tool that offers features for free that are paid elsewhere.